Hi there,
I recently upgraded my VPS that I’m running my BP node on as I noticed it was using a fair amount of ram/memory. It looked like it went without a hitch until I checked my grafana and noted that I’m getting gaps in my metrics coming from my BP node. The node is still running and appears to be processing transactions but I’m concerned as its never done this before. Any idea how to troubleshoot this?
Thanks in advance
DOC
What is the hardware configuration? It is possible to see these gaps due to insufficient RAM
The new version (1.27.0) is using ~8G RAM
16GB ram, 6 Cores
should be more than enough
And after the upgrade do u still have the issue?
yeah, actually started after the upgrade. Just rolled back to a previous snapshot to see if the problem sticks around
You dont happen to have any other ideas what could be causing the gaps?
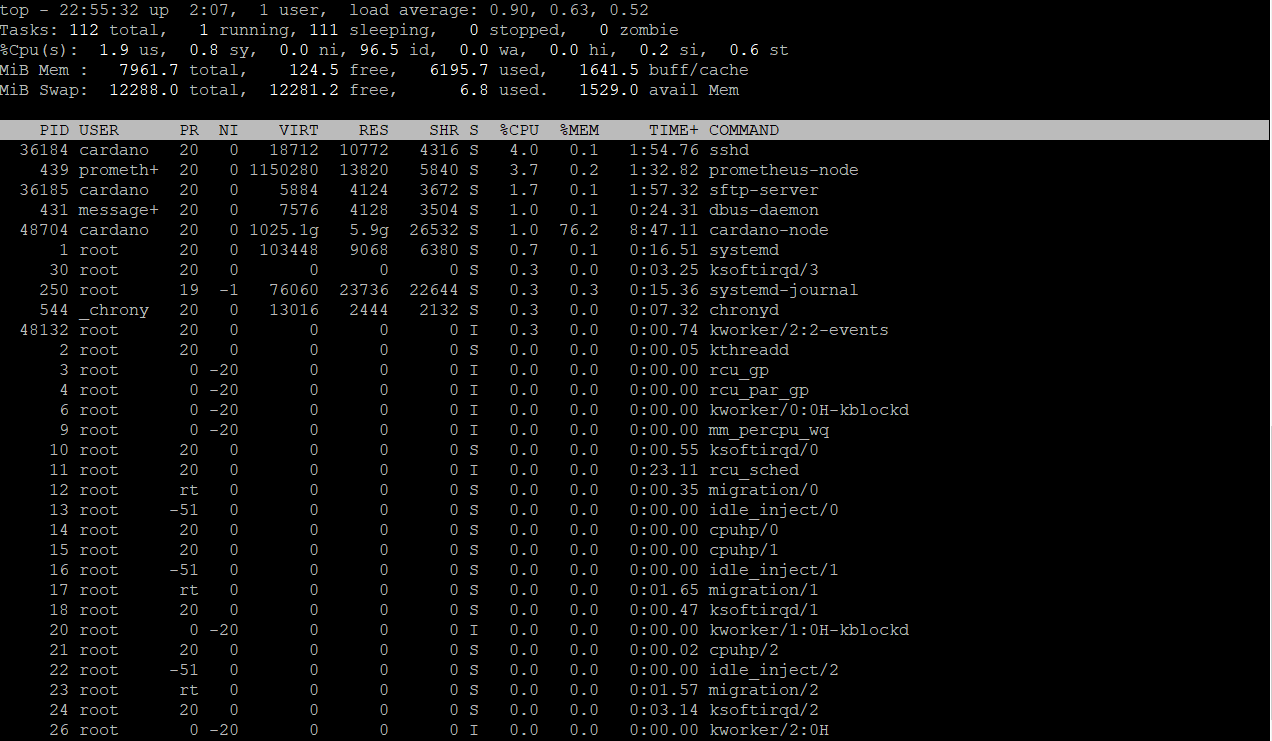
Type top and show me the output for cardano-node service
Just realized that for some reason after rolling back to my snapshot my ram + cpu went back to before the upgrade. Talking to the VPS provider now to straighten it out
still dopping metrics on grafana
Hi Alex, sorry to keep bugging you. It seems the issue is related to my memory / ram usage as it seems drop the metrics every time the memory usage spikes on grafana. Cant seem to figure out where the leak is though. The only thing I know is different between by relays and bp is that I have tracemempool set as true on my BP node. Going to see what happens when I set it to False. Any ideas yourself?
But u said u have 16G of ram right?
Try journalctl -e -f -u cardano-node
Do u see the killed message? Try to set the mempool to false (u will not see tx processed on grafana or glive) and monitor in grafana
seems to be mempool. Since setting it to false (around 10:30) no drops in Grafana. Any idea why its doing this though? Now that its off I cant really follow my Tx processed (which kind of sucks).
MEM issues, what is the HW configuration of the server? Type free -g
thats with mempool back on true (waiting node to start up again, will send updated pick once running again)
With 16G RAM u should not have issues with TraceMempool set to true
Still doing the same thing. Cant seem to find the process thats causing the mem leak.
Type top and check how much MEM is used by cardano-node
do u have 4G RAM and 11G swap?
And if u try journalctl -e -f -u cardano-node
do u see killed message?