Once you have sucessfully set-up a Cardano pool, then comes the most beautifull part - setting up your Dashboard and Alerts! You surely dont want to gaze the PC whole day, or?
I found it difficult to get all the information at one place so am writing this documentaion and hopeully it helps others as well. This tutorial is for education and learning purpose only.
Prerequisites:
-
Ubuntu Server 20.04 LTS (for Ubuntu 18.04 LTS please follow the alternative steps)
-
Cardano Block Producer Node (PN) up and running
-
Cardano Relay Nodes (RN) up and running
Content
1. Install prometheus node exporter on Block Producing Node
2. Install Prometheus and prometheus node exporter on Relay Node
3. Install Grafana on Relay Node
4. Setting up Grafana Dashboard
5. Add Data from Adapools to the Dashboard
6. Optional but Usefull: Add Live Data to your Dashboard using PoolData.Live API
7. As last step let’s now setup Grafana Alerting and Email Notifications
Recommended: Disabling Grafana Registrations and Anonymous Access
1. Install prometheus node exporter on Block Producing Node
for Ubuntu 20.04
$ sudo apt-get install -y prometheus-node-exporter
$ sudo systemctl enable prometheus-node-exporter.service
for Ubuntu 18.04 install node_exporter as prometheus-node-exporter does not expose all metrics
$ cd $HOME/git
$ wget https://github.com/prometheus/node_exporter/releases/download/v1.1.2/node_exporter-1.1.2.linux-amd64.tar.gz (choose your right server version)
$ tar xvfz node_exporter-1.1.2.linux-amd64.tar.gz
$ sudo cp node_exporter-1.1.2.linux-amd64/node_exporter /usr/local/bin
$ chown node_exporter:node_exporter /usr/local/bin/node_exporter
$ cd /etc/systemd/system
$ sudo nano node_exporter.service
Then, paste the following configuration for your service.
#############################
[Unit]
Description=Node Exporter
Wants=network-online.target
After=network-online.target
[Service]
User=
ExecStart=/usr/local/bin/node_exporter
[Install]
WantedBy=default.target
#############################
Exit nano, reload your daemon, and start your service.
$ sudo systemctl daemon-reload
$ sudo systemctl start node_exporter
$ sudo systemctl enable node_exporter.service
for Ubuntu 18.04 use from now on in the tutorial the node_exporter.service instead of prometheus-node-exporter.service
Update mainnet-config.json config files with new hasEKG and has Prometheus ports.
$ cd $NODE_HOME
$ sed -i mainnet-config.json -e “s/127.0.0.1/0.0.0.0/g”
On PN you need to open ports 12798 and 9100
$ sudo ufw allow proto tcp from to any port 9100
$ sudo ufw allow proto tcp from to any port 12798
$ sudo ufw reload
restart the node
$ sudo systemctl restart
2. Install Prometheus and prometheus node exporter on Relay Node
install Prometheus
$ sudo apt-get install -y prometheus
Install prometheus node exporter on RN (Ubuntu 20.04)
$ sudo apt-get install -y prometheus-node-exporter
for Ubuntu 18.04 repeat the steps of PN above in the RN as well and install the node_exporter service instead
repeat Step 2 for all your RN
3. Install Grafana on Relay Node
$ wget -q -O - https://packages.grafana.com/gpg.key | sudo apt-key add -
$ echo “deb https://packages.grafana.com/oss/deb stable main” > grafana.list
$ sudo mv grafana.list /etc/apt/sources.list.d/grafana.list
$ sudo apt-get update && sudo apt-get install -y grafana
Enable services so they start automatically
$ sudo systemctl enable grafana-server.service
$ sudo systemctl enable prometheus.service
$ sudo systemctl enable prometheus-node-exporter.service
Update prometheus.yml located in /etc/prometheus/prometheus.yml
Change the in the following command
$ cat > prometheus.yml << EOF
global:
scrape_interval: 15s # By default, scrape targets every 15 seconds.
Attach these labels to any time series or alerts when communicating with
external systems (federation, remote storage, Alertmanager).
external_labels:
monitor: ‘codelab-monitor’
A scrape configuration containing exactly one endpoint to scrape:
Here it’s Prometheus itself.
scrape_configs:
The job name is added as a label job=<job_name> to any timeseries scraped from this config.
- job_name: ‘prometheus’
static_configs:
- targets: [‘localhost:9100’]
labels:
alias: ‘relaynode1’
type: ‘cardano-node’
- targets: [‘<relay node 2 public ip address>:9100’]
labels:
alias: ‘relaynode2’
type: ‘cardano-node’
- targets: [‘:9100’]
labels:
alias: ‘block-producer-node’
type: ‘cardano-node’
-
targets: [‘localhost:12798’]
labels:
alias: ‘relaynode1’
type: ‘cardano-node’ -
targets: [‘<relay node 2 public ip address>:12798’]
labels:
alias: ‘relaynode2’
type: ‘cardano-node’
- targets: [‘:12798’]
labels:
alias: ‘block-producer-node’
type: ‘cardano-node’
EOF
if you have more than two RNs, add all your Relays as new “targets” in the config above
$ sudo mv prometheus.yml /etc/prometheus/prometheus.yml
restart the services
$ sudo systemctl restart grafana-server.service
$ sudo systemctl restart prometheus.service
$ sudo systemctl restart prometheus-node-exporter.service
Verify that the services are running properly
$ sudo systemctl status grafana-server.service prometheus.service prometheus-node-exporter.service
On RN open ports 3000 for Grafana
$ sudo ufw allow from to any port 3000
4. Setting up Grafana Dashboard
On RN, open http://localhost:3000 or http://:3000 in your local browser.
Login with admin / admin
Change password
Click the configuration gear icon, then Add data Source
Select Prometheus
Set Name to “Prometheus”
Set URL to http://localhost:9090
Click Save & Test
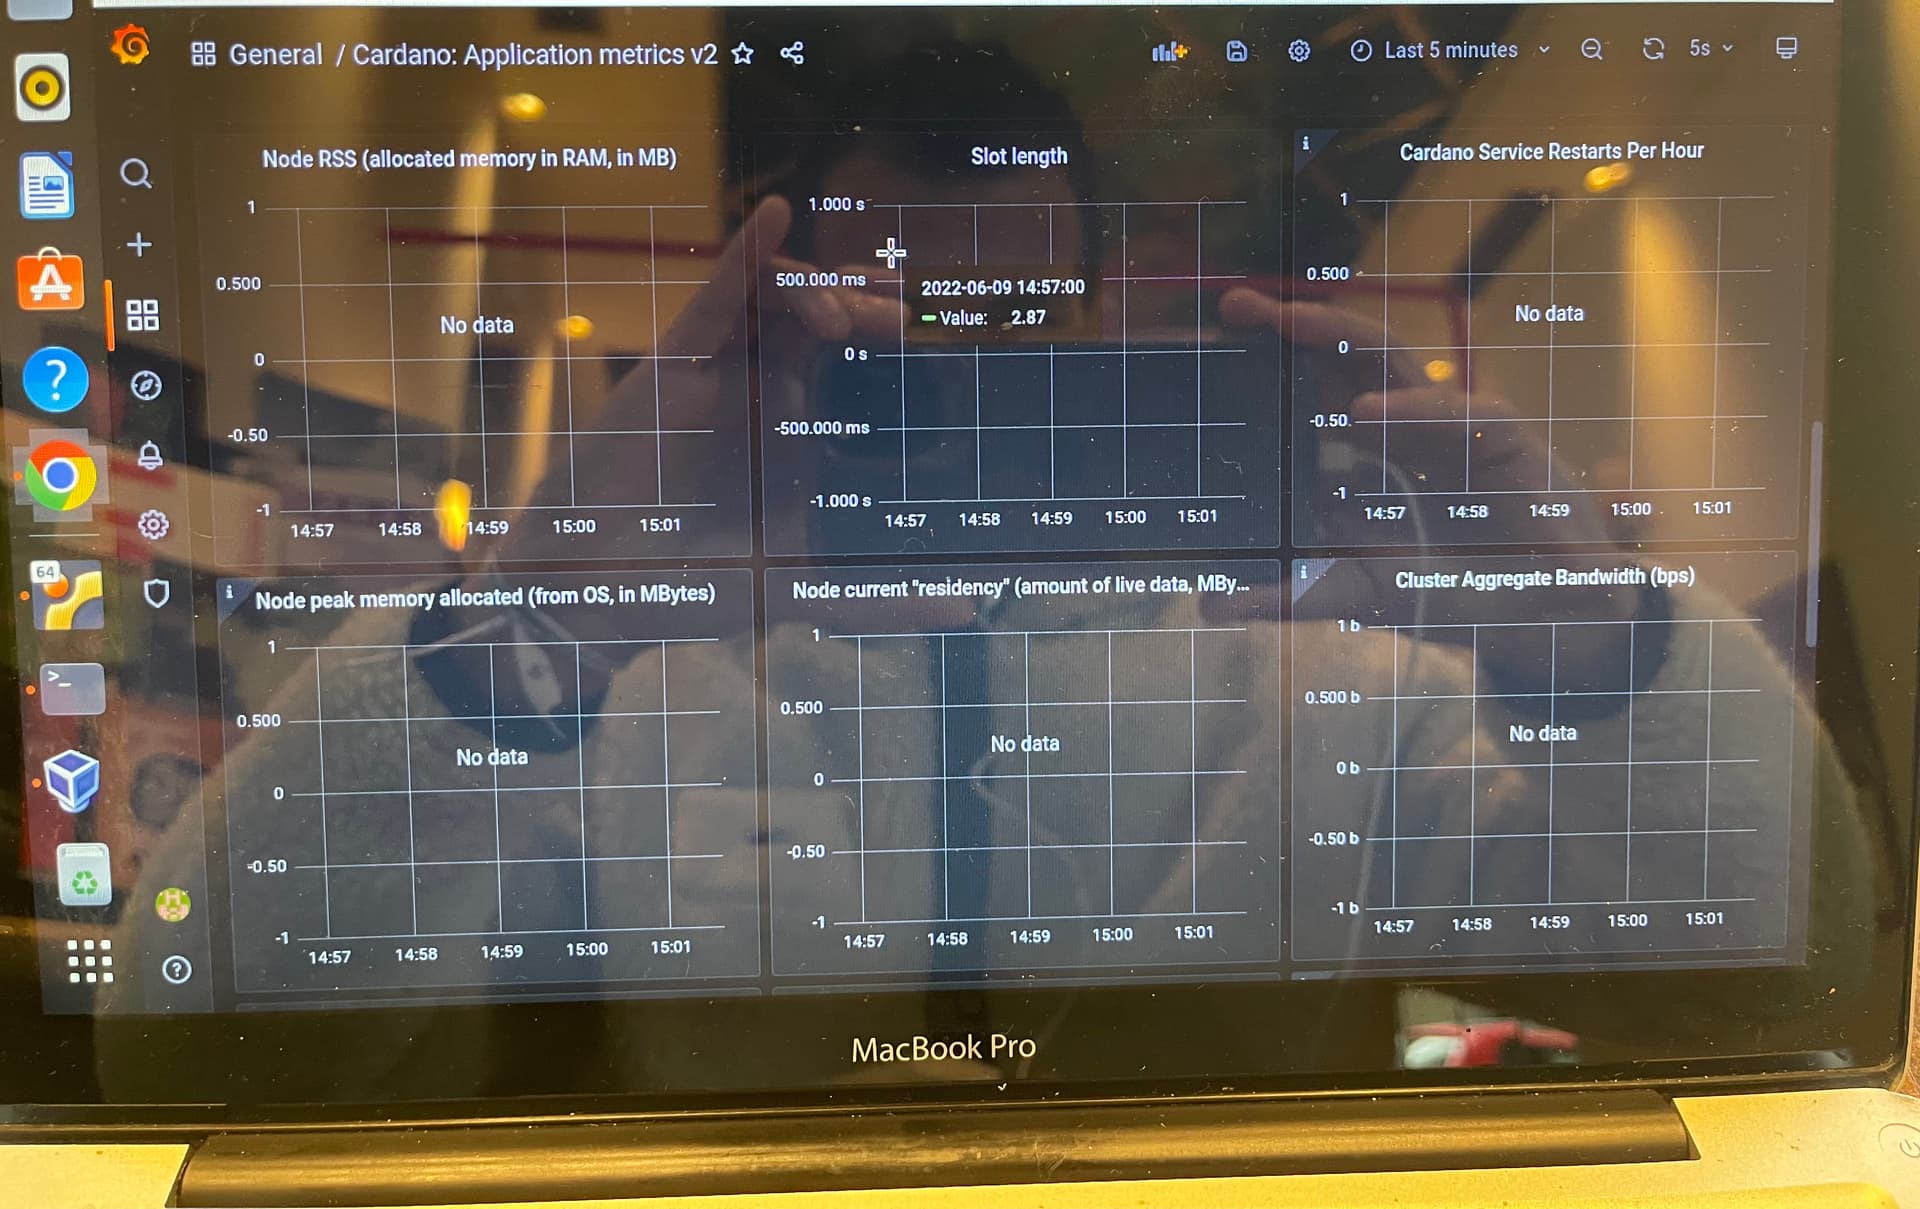
Download my Dashboard that you see on the top of this page, from the following GitHub link and save the JSON file
https://raw.githubusercontent.com/sandy4de/SNSKY/main/SNSKY_Dashboard_v2.json
in Grafana, Click Create + icon (in left Menu) > Import
Add dashboard by Upload JSON file
Click the Import button.
If you nodes are in several time zones, it is usefull to add the Grafan Clock panel
$ grafana-cli plugins install grafana-clock-panel
Installed panels are available immediately in the Dashboards section in your Grafana main menu.
To see a list of installed panels, click the Plugins item in the main menu. Both core panels and installed panels will appear.
5. Add Data from Adapools to the Dashboard
Copy your JSON link or your Pool ID from Share/Promote Tab and JSON data outputs in apapools.org
Prometheus can work only with numeric data, so we must first trim non numeric strings which is returned from the JSON file. Lets create a shell script getstat.sh for the same
###############################
cd /$NODE_HOME
mkdir -p poolStat
cd poolStat
echo "curl Cardano Explorer | Cexplorer.io< YOUR POOL ID >/summary.json 2>/dev/null \
| jq ‘.data | del(.pool_id_bech32, .hist_bpe, .handles, .hist_roa, .db_ticker, .db_name, .db_url, .ticker_orig, .group_basic, .pool_id, .direct, .db_description, .tax_ratio_old, .tax_fix_old)’ \
| tr -d \"{},: \
| awk NF \
| sed -e ‘s/[1]*/adapools_/’ > poolStat.prom" > getstats.sh
chmod +x getstats.sh
./getstats.sh
###############################
check the content of adapools.prom and it should not contain only numeric values
$ nano poolStat.prom
Configure promethues-node-exporter.service to grab data from poolStat.prom file
$ sudo cp /lib/systemd/system/prometheus-node-exporter.service /lib/systemd/system/prometheus-node-exporter.service_backup
$ sudo nano /lib/systemd/system/prometheus-node-exporter.service
Change ExecStart line to
##############################
ExecStart=/usr/bin/prometheus-node-exporter --collector.textfile.directory=< YOUR NODE FULL PATH >/poolStat --collector.textfile
##############################
Reload daemon and restart services
$ sudo systemctl daemon-reload
$ sudo systemctl restart prometheus-node-exporter.service
$ sudo systemctl restart prometheus.service
Now you should see in the Dashboard all Adapool statistics
Since the statistics will change, lets set cron job to update data from ADApools everyday
$ crontab -e
##############################
#Get data from ADApools every day at 06:00
0 6 * * * /adapools/getstats.sh
##############################
Done!
6. Optional but Usefull: Add Live Data to your Dashboard using PoolData.Live API
In the method in Step 5 we get the data by running a cron job and so it’s not Live. In case you wish to have live data from the Mainnet for example to get immidiate Alerts in case your Pledge reduces or you have new delegators then the API from PoolData is very usefull. Additionaly, as in the adapools method we have to trim all non numeric strings we have limited metrics. With PoolData we have access to wider range of metrics like Delegator list.
As a first Step we need to install the Plugin - JSON
$ grafana-cli plugins install simpod-json-datasource
now login into your Grafana and under Configurations → Data sources section, click on “Add data source” - you will see the new JSON datasource available at the end of the list.
Now lets configure JSON to load your Pool data into grafana. Under HTTP Section and URL field paste the following:
https://api.pooldata.live/cardano/< YOUR POOL ID >
where < YOUR POOL ID > is the same ID that you got from adapools.org in Step 5
Now press “Save and test” and you will start receiving live data directly in your Dashboard.
7. As last step let’s now setup Grafana Alerting and Email Notifications
Setup SMTP in Grafana
$ sudo nano /etc/grafana/grafana.ini
Edit the SMTP section
#############################
[smtp]
enabled = true
host = smtp.:465
user =
If the password contains # or ; you have to wrap it with triple quotes. Ex “”“#password;”“”
password =
from_address = sam@sanskys.de
from_name = Grafana
#############################
Login to Grafana with username and password.
Click on the “Bell” icon on the left sidebar.
Select “Notification channels.”
Click on “Add Channel.” This will open a form for adding new notification channel.
Give a name to this channel. I am using “Alert”
Select Email from “Type” as we want to send notifications over email.
Check the “Send on all alerts” in case you want email on all alerts.
Select the checkbox of “Include image” in case you want to include the image of the panel as the body in the notification email.
Add the target email in “Email addresses” text area. You can use multiple email address separated by “;”
Click on “Send Test” if you want to verify your settings. This will send a sample email using the SMTP details we configured earlier.
Click on “Save” to add this channel
Create an Alert if PN is not reachable
Please not that Alerts can only be created for “Graph” panels!
Now we create an Alert to get an emaial if the PN is not reachable
In the “Connected Peers” panel go to Alerts
Define the Rule “Connected Peer Alert” Evaluate every “1m” For “2m”
Condition
WHEN “last()” OF “query(A, 1m, now)” “HAS NO VALUE”
No Data & Error Handling
If no data or all values are null SET STATE TO “No Data”
If execution error or timeout SET STATE TO “Alerting”
Notifications
Send To - Choose your notofication channel, which in my case is “Alert”
Message - type in your alert message that should appear in the email
Press on “test Rule” to ensure that the Alert is correct and has no issues.
Now you are done! Stop you PN and you should get an Alert within 4min.
If everything works, now you should have a smile on your face and if you wish you could donate me 1 ADA or delegate to my pool - Sam’s North SKY [SNSKY]
addr1qyyhd8cpv4gmhr5axerhezhtzldrw4rp9ayf0fc6arnme4cg46du2qg366943uy0dw5yjmna7arfw265lu4r2fjccl4scf7xrw
Recommended: Disabling Grafana Registrations and Anonymous Access
We should make Grafana a bit more sucure and to do so lets change two settings
$ sudo nano /etc/grafana/grafana.ini
Locate the following allow_sign_up directive under the [users] heading and change the line to as follows
##########
[users] # disable user signup / registration
allow_sign_up = false
##########
Next, locate the following enabled directive under the [auth.anonymous] heading and change the line to as follows
##########
[auth.anonymous]
enabled = false
##########
Save the file and exit your text editor and to activate the changes, restart Grafana:
$ sudo systemctl restart grafana-server
I have included a panel on Leadslots, which can Alert in case your pool is selected as a leader for the next Epoch. It is a bit more complicated, so will leave it out of the tutorial, but in principle there is script running on the PN which updates the leader query result in a prom file which is parsed by the node exporter, exposing this metrics to the RN. In case you wish to use it and need the details, just drop me a message on Telegram.
References:
https://forum.cardano.org/t/please-share-your-grafana-dashboards-for-cardano-node/
\t ↩︎