
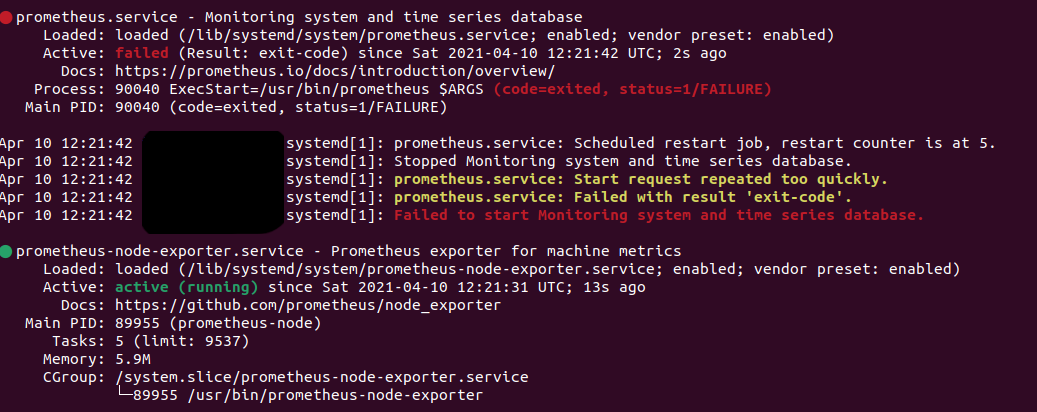
This is what is showing now
Check again the yml config on relay (check the BP ip)… and restart the services
BP
sudo systemctl restart prometheus-node-exporter.service
Relay
sudo systemctl restart grafana-server.service
sudo systemctl restart prometheus.service
sudo systemctl restart prometheus-node-exporter.service
How is the service on relay? Running?
sudo systemctl status prometheus.service
1 Like
AH!! I had ‘<’ in one of the targets!
1 Like
Thanks Alex, silly mistake on my part.
1 Like
No problem, also opening the ports helped
1 Like
Hi Alex,
Hope you are well. I have a slight issue with prometheus.service. I read through some threads on the forum relating to the same issue but I couldn’t get it fixed. attached are the Prometheus status and .yml file
Cheers

How many nodes do u have?
Just BP and 1 Relay atm
it was working fine up until I updated the nodes to 1.26.1
Aaa ok. So it worked before and now don’t;
Try to install again prometheus and see if it will starts with the default configuration
Then update again the prometheus.yml file and restart prometheus
I did that earlier but, something isn’t syncing properly, I am guessing its something to do with the config file. I will try to do it again later 
@Anti.biz has the same issue with one of relay after update… keep us informed
2 Likes
During the update… a new config file was downloaded?
Hi Alex,
so I reinstalled prometheus and prometheus node exporter onto the Relay and BP but still no luck on the prometheus .service. It is still failing. I might edit the yml config file to match the one that @Anti.biz has.
1 Like

Thanks! I will edit mine now
Make sure your ip didnt change at all, mine disapeared because my private ip changed on my server.

I restarted prometheus and service still fails. I think the relay node exporter ip should be 0.0.0.0? and changed port to 9100. Still no luck

A scrape configuration containing exactly one endpoint to scrape:
Here it’s Prometheus itself.
scrape_configs:
The job name is added as a label job=<job_name> to any timeseries scraped from this config.
- job_name: ‘BP_cnode’
static_configs:- targets: [‘x.x.x.x:12798’]
labels:
instance: “Producer”
- targets: [‘x.x.x.x:12798’]
- job_name: ‘BP_node_exporter’
static_configs:- targets: [‘x.x.x.x:9100’]
labels:
instance: “Producer”
- targets: [‘x.x.x.x:9100’]
- job_name: ‘Relay1_cnode’
static_configs:- targets: [‘127.0.0.1:12798’]
labels:
instance: “Relay1”
- targets: [‘127.0.0.1:12798’]
- job_name: ‘Relay1_node_exporter’
static_configs:- targets: [‘127.0.0.1:9100’]
labels:
instance: “Relay1”
- targets: [‘127.0.0.1:9100’]
- job_name: ‘Relay2_cnode’
static_configs:- targets: [‘x.x.x.x:12798’]
labels:
instance: “Relay2”
- targets: [‘x.x.x.x:12798’]
- job_name: ‘Relay2_node_exporter’
static_configs:- targets: [‘x.x.x.x:9100’]
labels:
instance: “Relay2”
- targets: [‘x.x.x.x:9100’]