Make sure your ports are open correctly. Basically the Block producer needs opened for prometheus/grafana.
yes 0.0.0.0 in mainnet.
I had this problem. What solved it was making sure all my ports were good and my promtheus.yml had the right spacing.
Make sure your ports are open correctly. Basically the Block producer needs opened for prometheus/grafana.
yes 0.0.0.0 in mainnet.
I had this problem. What solved it was making sure all my ports were good and my promtheus.yml had the right spacing.
Ports are open, and config file updated accordingly… I am tried restarting and no luck 
Your .yml looks good.
Do you have node-exporter, prometheus service, and grafana all on yoour relay?
Also what are your servers running on ? AWS? amazon?
Yes AWS and was working before I did V 1.26.1
Ports 9100 & 12798 open on BP
Port 3000 on Relay
node-exporter, prometheus service, and grafana are on my Relay
Did you check if your ip might of changed like are you using private ips? that happened to me because i killed the instance.
and did you open the ports for your relay on 127.0.0.1 / 0.0.0.0 ?
IP is the same, I have static IP so even if it stops, it doesn’t change
im using an elastic IP for the public ip but not private. my prometheus service was doing the same thing it was all due to the .yml being off with the spacing and quotes “”
Thanks @Anti.biz, Yeah Ill try and figure out whats wrong with it. Ill keep you informed 

But after u reinstalled the prometheus it started with the default yml configuration?
Hi Alex,
I don’t think it did
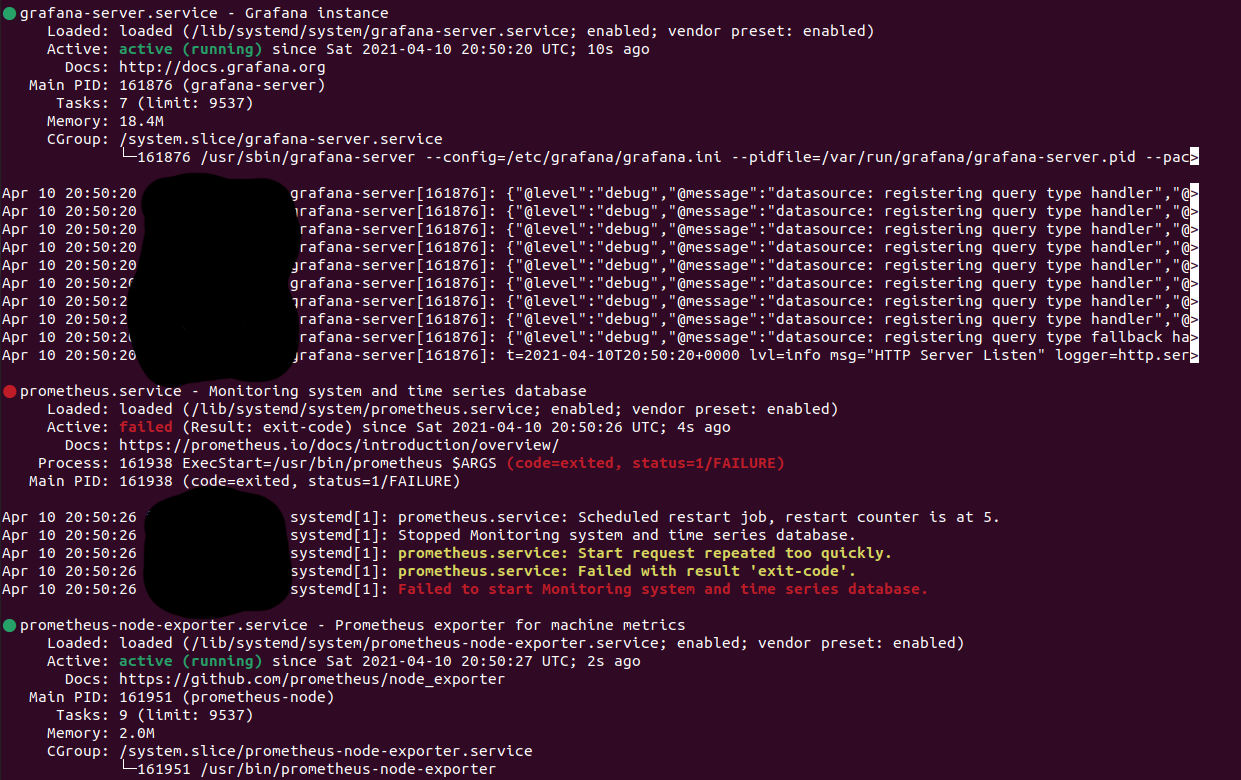
Hi Alex, yeah, so I reinstalled prometheus with its default config and changed the params to match what I have above with the right spacing but I still get the prometheus.service error. Ports are open on the cloud fw and everything seems to be correct. I don’t know if I should be looking somewhere else for the issue.
Thanks
Did u checked if with the default configuration prometheus started?
“Server is ready to receive web requests.”
So I will edit the config file now and check.
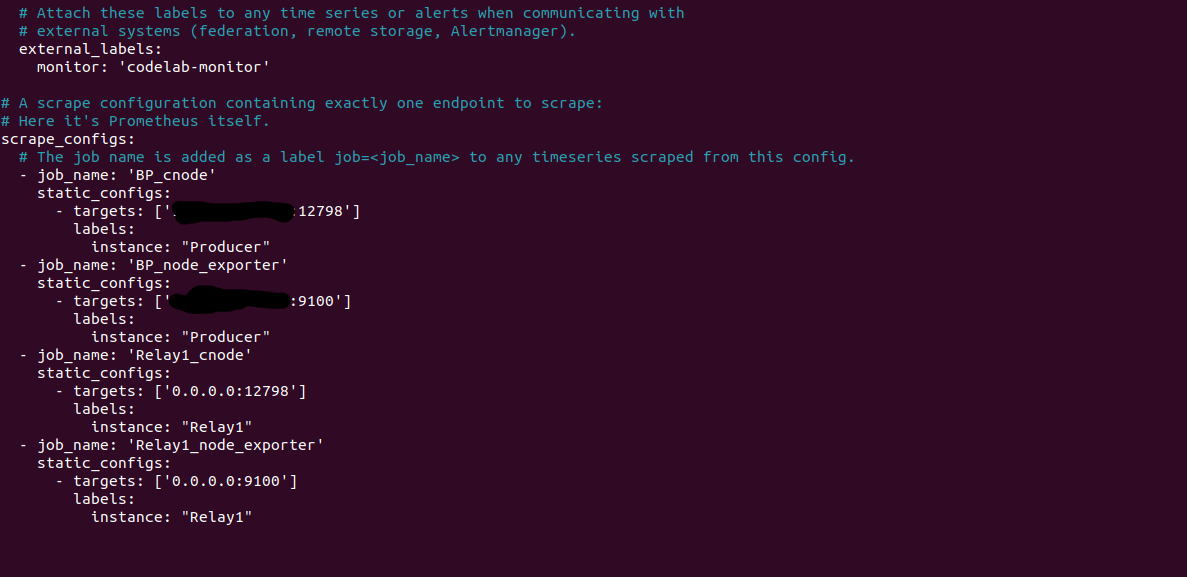
global:
  scrape_interval:     15s # By default, scrape targets every 15 seconds.

  # Attach these labels to any time series or alerts when communicating with
  # external systems (federation, remote storage, Alertmanager).
  external_labels:
    monitor: 'codelab-monitor'

# A scrape configuration containing exactly one endpoint to scrape:
# Here it's Prometheus itself.
scrape_configs:
  # The job name is added as a label `job=<job_name>` to any timeseries scraped from this config.
  - job_name: 'prometheus'

    # Override the global default and scrape targets from this job every 5 seconds.
    scrape_interval: 5s

    static_configs:
      - targets: ['localhost:9090']
Got it working! started it with ```
./prometheus --config.file=prometheus.yml
After I update the file and synced up nicely! Thanks again @Alexd1985 @Anti.biz
What do you mean you started it with ```
Sorry that was a typo! Started with ./Prometheus
…
What do you mean you started what as a script?
So I re-downloaded prometheus with the default config and started proemtheus with “./prometheus --config.file=prometheus.yml” to see if it was receiving web requests. As it was, then I pdated the Yml config file to match my IP and ports, and re-ran the script above.